What is SHAP?
Shapley Additive Explanations (SHAP) is a unified approach to interpreting predictions from machine learning models. It assigns an importance value—referred to as a “SHAP value”—to each feature of a given prediction, indicating how much that feature contributed to moving the prediction from a baseline (or expected) outcome to the actual outcome the model generated.
The name “SHAP” comes from the Shapley values, a concept borrowed from cooperative game theory, combined with the idea of having Additive Explanations, where the overall prediction is broken down as a sum of feature contributions.
SHAP aims to satisfy a series of desirable properties (from game theory) that ensure fairness and consistency in how feature contributions are measured. The result is a principled method that can be applied to any type of machine learning model—treating the model as a “black box”—as long as you can query predictions for given inputs.
Theoretical Foundations: Shapley Values
The backbone of SHAP is the Shapley value, originally defined in the context of cooperative game theory by Lloyd Shapley in 1953. Shapley values were created to fairly distribute payouts (rewards) among players who work as a coalition. Each player’s Shapley value represents their average contribution to the coalition’s payoff, assuming all possible orders of player arrival are equally likely.
Key Idea in SHAP:
- Consider your model as a “game” where the “players” are the input features.
- The “payout” is the model’s prediction.
- The question is: How do we fairly distribute the credit (or blame) for the final prediction among all the input features?
The Shapley value provides a unique solution that meets certain fairness axioms:
- Efficiency: The sum of all Shapley values is equal to the difference between the final prediction and a chosen baseline (often the average prediction over the dataset).
- Symmetry: If two features contribute equally to the outcome, they receive equal value.
- Dummy: If a feature does not affect the prediction regardless of whether it is included, it should receive zero contribution.
- Additivity: Explanations for complex models composed of submodels should be consistent with explanations for those submodels.
By relying on these axioms, Shapley values ensure a fair and principled allocation of contribution.
SHAP in a Machine Learning Context
When applying Shapley values to machine learning:
- Features = Players: Each input feature is considered a player in a cooperative game.
- Model Prediction = Payout: The model’s prediction for a given instance can be thought of as a payout.
- Baseline/Reference Value: SHAP often uses the average model prediction (over the training data or a sample thereof) as a baseline. SHAP values then explain how each feature shifts the prediction from this baseline expectation to the specific instance’s predicted value.
To compute the SHAP value for a single feature$f$:
- Consider all possible subsets of features not including $f$.
- For each subset $S$, consider how the model’s prediction changes when adding $f$ to $S$.
- Average this change over all subsets $S$ of the other features.
Mathematically, the Shapley value for feature $f$ is:
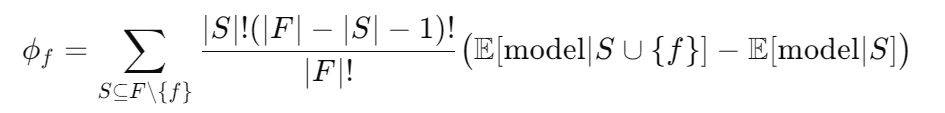
Here, $F$ is the set of all features, $E[model∣S]\mathbb{E}[\text{model}|S]E[model∣S] $represents the model’s expected prediction when only features in $S$ are known (other features are marginalized out), and $∣F∣|F|∣F∣$ is the total number of features.
Interpretation: The SHAP value$ ϕ_f$ tells us how much knowing feature $f$ contributes on average (over all possible subsets) to pushing the prediction away from the baseline.
SHAP Implementation: Model-Agnostic Explanations
SHAP is considered model-agnostic because it relies only on the ability to call the model and get predictions. You do not need access to model internals or gradients. However, directly computing exact Shapley values can be computationally expensive, as it involves summing over all subsets of features (exponential in the number of features).
To handle complexity, SHAP provides various approximation methods and special cases:
- Kernel SHAP: A model-agnostic approximation using a LIME-like weighting strategy to approximate Shapley values. This can handle any black-box model but may be slower for large numbers of features.
- Tree SHAP: An efficient algorithm specifically designed for tree-based models (e.g., random forests, gradient-boosted decision trees like XGBoost, LightGBM, CatBoost) that computes exact Shapley values in polynomial time, leveraging the structure of decision trees.
- Deep SHAP: An approximation for deep neural networks based on DeepLIFT, extending the idea of Shapley values into neural architectures.
- Linear SHAP: For linear models, where exact computation is straightforward.
SHAP Plots and Interpretations
SHAP comes with various plots to visualize feature contributions:
- Force Plots: Display how each feature’s SHAP value pushes the prediction higher or lower than the baseline. Features pushing upward (positive SHAP values) increase the prediction, those pushing downward (negative SHAP values) reduce it.
- Summary Plots: Combine SHAP values for many instances to show global patterns. For example, a summary plot shows each feature’s distribution of SHAP values across a dataset, indicating not only feature importance but how features influence predictions in both positive and negative directions.
- Dependence Plots: Show how SHAP values for a given feature vary with that feature’s actual values, often revealing non-linear relationships and interaction effects.
Advantages of SHAP
- Theoretical Foundation (Fairness and Consistency):
Shapley values have a strong mathematical grounding that ensures certain fairness properties. This theoretical rigor helps users trust that the attributions are not arbitrary. - Global and Local Interpretations:
SHAP values are local explanations—that is, they explain a single prediction at a time. Yet, by aggregating across many predictions, SHAP also supports global understanding. You can see how features behave on average and which features are universally important. - Model-Agnostic and Flexible:
SHAP can be applied to any model as long as you can query it for predictions. Additionally, specialized variants like Tree SHAP and Deep SHAP provide efficient solutions for certain model classes. - Rich Visualization and Diagnostic Tools:
The SHAP library includes a variety of visualization tools that make it easier for non-technical stakeholders to understand and trust model predictions.
Limitations and Considerations
- Computational Complexity:
The exact computation of Shapley values is exponential in the number of features. For high-dimensional datasets, approximation methods are needed. This can still be expensive, especially for complex models, though methods like Tree SHAP mitigate this for tree ensembles. - Choice of Baseline Distribution:
SHAP explanations depend on the choice of a baseline or reference distribution. Typically, a mean prediction or a representative sample from the data is used. Different baselines can yield different SHAP values, so careful selection is crucial. - Statistical Dependence and Interaction Effects:
While Shapley values handle feature interactions by averaging over all subsets, interpreting these values can still be challenging if features are heavily correlated. The values represent average marginal contributions, which might be less intuitive when strong feature dependencies exist. - Single-Instance Focus:
SHAP is inherently local. Although you can aggregate results for global insights, each explanation on its own describes one instance. For a complete picture, you must consider many instances.
Comparing SHAP to Other Methods
- SHAP vs. LIME:
LIME also provides local, model-agnostic explanations by approximating complex models with simple, interpretable ones near a single instance. However, LIME uses heuristic approximations and does not guarantee the fairness axioms that SHAP does. SHAP values are more consistent and theoretically grounded, but LIME can sometimes be faster or simpler to implement. - SHAP vs. QII (Quantitative Input Influence):
QII measures how input distribution changes affect output distributions, focusing more on global and distribution-level explanations. SHAP offers a direct, per-feature contribution measure at the instance level. QII can handle correlated features and distribution changes elegantly, but it is often more complex and computationally heavy. SHAP is more commonly used in practice due to well-developed tooling and visualizations. - SHAP vs. PDP/ICE (Partial Dependence Plots, Individual Conditional Expectation):
PDPs and ICE curves provide a more global or semi-global perspective on how changing a feature value influences predictions. They do not inherently provide a single-value explanation per instance. SHAP complements these methods by providing instance-level attributions. In practice, combining PDP/ICE with SHAP can yield both local and global insights.
Practical Use Cases
- Regulatory Compliance:
In finance or healthcare, regulatory frameworks demand explanations for model-based decisions. SHAP can clearly show how specific attributes of a loan applicant affected the approval score, aiding compliance and trust-building. - Debugging and Model Improvement:
Data scientists can use SHAP values to detect anomalies, unexpected patterns, or suspicious feature influences. If a seemingly irrelevant feature has a large SHAP value, it may indicate data leakage or a model artifact needing correction. - Communication with Stakeholders:
SHAP’s intuitive visualizations and fair distribution of contributions help build trust with non-technical team members, executives, or clients who want to understand why an AI system makes certain predictions. - Feature Engineering and Selection:
By reviewing SHAP values across many predictions, you can identify which features consistently have low contribution and consider removing them to simplify the model. Conversely, important features can be further engineered for performance gains.
Conclusion
Shapley Additive Explanations (SHAP) stand out as one of the most robust and theoretically principled frameworks for explaining the output of black-box machine learning models. By marrying the fairness and rigor of Shapley values with user-friendly tools and visualizations, SHAP enables both data scientists and decision-makers to trust, interpret, and act on model predictions responsibly. Its wide adoption, especially in sensitive domains, underscores its importance in bridging the gap between sophisticated AI models and the human need for transparency, accountability, and understanding.